
CLUSTERING
OVERVIEW
The literal meaning on the word "cluster" is a group of similar items or things or people, occurring closely together. Clustering essentially is the process of dividing a large set of data points into smaller groups, or clusters, based on the similarities between the data points. The aim is to identify natural structures and patterns in the data, while effectively grouping similar data points together. The data points within a cluster are more similar to each other than they are to the data points in other clusters.
There are several popular clustering algorithms, including k-means, hierarchical clustering, partitional clustering and density-based clustering. Each of these algorithms uses different methods to group data points into clusters, and the choice of algorithm will depend on the nature of the data and the goals of the analysis.
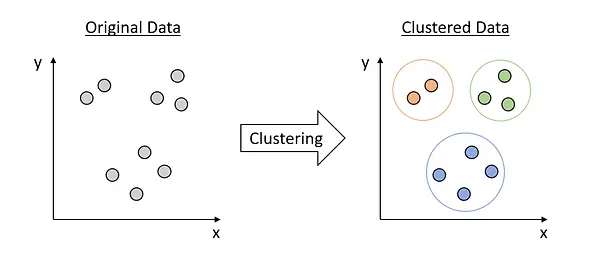
Figure 1 - Clustering
DISTANCE METRICS
Distance metrics are measures used to quantify the dissimilarity or similarity between two data points in a clustering problem. These metrics are used in various clustering algorithms to group similar data points into clusters. Here are some common distance metrics used in clustering:
-
Euclidean Distance: The Euclidean distance is the most common distance metric used in clustering. It is defined as the straight-line distance between two points in n-dimensional space. It is calculated as the square root of the sum of the squared differences between the corresponding coordinates of two data points. It assumes that the dimensions of the data are continuous and have the same scale. Formula for Euclidean Distance:
-
Manhattan Distance: The Manhattan distance (also called city-block distance or L1 distance) is the distance between two points measured along the axes at right angles. It is calculated as the sum of the absolute differences between the corresponding coordinates of two data points. It is useful when the dimensions of the data are discrete or categorical. Formula for Manhattan Distance:
-
Cosine Similarity: The cosine similarity measures the cosine of the angle between two vectors in n-dimensional space. It is calculated as the dot product of the two vectors divided by the product of their magnitudes. It is useful when the dimensions of the data are not independent and have different scales. Formula for Cosine Similarity.
Note: The choice of distance metric depends on the nature of the data and the specific clustering algorithm being used. The appropriate distance metric can help to improve the accuracy and effectiveness of the clustering algorithm.


TYPES OF CLUSTERING
There are several types of clustering techniques, and each type has its unique characteristics and applications. Here, we will be discussing two of the most common clustering techniques:
-
Partitional Clustering: Partitional clustering algorithms, such as k-means, work by dividing a set of data points into a fixed number of clusters, k, where k is a user-defined parameter. The algorithm starts by randomly assigning each data point to one of the k clusters, and then iteratively adjusts the cluster assignments and cluster centroids until a stable solution is reached. Partitional clustering algorithms are fast and efficient for large datasets, but they have the limitation that the number of clusters, k, must be specified in advance and can be sensitive to the initial placement of the clusters.
-
Hierarchical clustering: Hierarchical clustering algorithms, on the other hand, do not require the number of clusters to be specified in advance. They work by recursively splitting the data into smaller and smaller clusters, resulting in a tree-like structure known as a dendrogram. There are two main types of hierarchical clustering: agglomerative and divisive. Agglomerative clustering starts with each data point as its own cluster and then combines clusters into larger clusters, while divisive clustering starts with all data points in a single cluster and then splits the cluster into smaller clusters. Hierarchical clustering algorithms are more flexible and can identify clusters of varying shapes and sizes, but they can be slower and more computationally intensive than partitional algorithms.
In summary, the choice between partitional and hierarchical clustering will depend on the nature of the data and the goals of the analysis. Partitional algorithms are fast and efficient for large datasets with well-defined clusters, while hierarchical algorithms are more flexible and can handle more complex data structures.
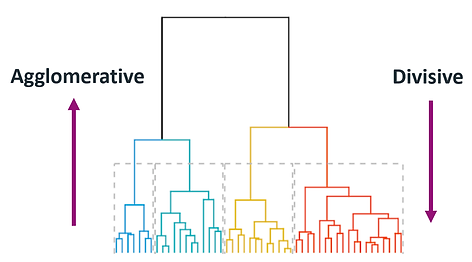

Figure 2 - Partitional Clustering
Figure 3 - Hierarchical Clustering
PROJECT USE CASE
We at Nerd Soccer plan to use clustering methods on various types of data to gain insights into what factors contribute to a team's success in Europe's top 5 football leagues.
The data we have used includes match statistics, having data on goals scored, shots on target, and possession. Shooting statistics include data on shots taken, shot accuracy, and conversion rates. Defensive data comprise of data on interceptions, tackles, and clean sheets.
We have also incorporated nationality data, which includes information on the number of players from each country, performance of players from different nationalities, what position do players from different nationalities play in
By using clustering methods on these different types of data, we hope to uncover trends and insights into what makes teams successful across these leagues. Higher possession rates? or better shooting accuracy? or something else?
The insights gained from this analysis could be used to guide team selection, recruitment strategies, and training programs for teams looking to improve their performance in these leagues. It could also inform strategic decisions for clubs, such as which players to target in the transfer market or which playing styles to adopt.
DATA PREP
Clustering being an unsupervised-algorithm, works by identifying patterns and similarities in the data, without any prior knowledge of the labels or categories that the data points belong to. This is in contrast to supervised learning techniques, such as classification, which require labeled data in order to train the model.
Numeric data is particularly well-suited for clustering because it is easy to measure and compare. Numeric data can be easily represented as vectors in a multi-dimensional space, and distances between data points can be calculated using various distance metrics. This allows clustering algorithms to identify patterns and similarities in the data, and group similar data points together.
However, it is important to note that not all clustering algorithms require numeric data. There are also clustering algorithms that can handle categorical or text data, although these algorithms typically require additional preprocessing steps to convert the data into a numeric format.
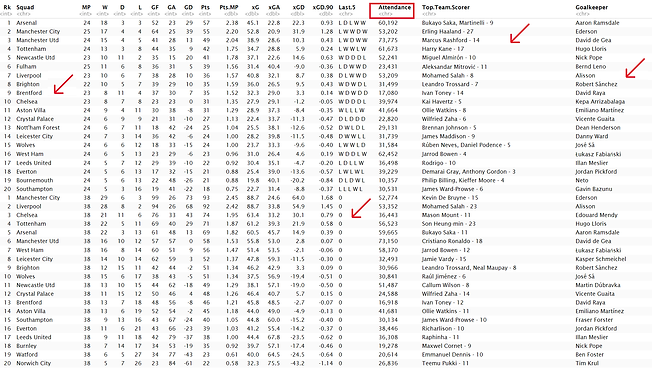
Figure 4 - Raw data before transformation
Figure 4 above shows the raw data which was gathered using APIs. The dataset shown is of Table stats of the English Premier League - the data consists stats from the current season to the past 11 seasons. As can be seen, the dataset above is not fit to be clustered. Columns are not in proper format, data is missing, zeros are present, labels are present and text data is mixed up with numeric data. The arrows are guides to showcase the irregularities in the raw data.
Hence, unnecessary columns were removed, making use of the gsub function, the column with improper data type was rectified, and lastly, the data items were scaled and normalized before implementing clustering algorithms onto it.
Figure 5 below is a snippet of the clean and transformed dataset, ready for use! (before scaling)

Figure 5 - Clean Data after transformation
RESULTS
k-means
The results of k-means clustering provide information on how the data points are grouped together, and how similar or dissimilar the different clusters are. This information can be used to gain insights into the structure of the data, and to make predictions or decisions based on the clustering results. The below visualizations help better understand the results. We have applied k-means clustering algorithm to the data containing 2021-2022 season stats across Europe's top 5 leagues and this is what we got.
 |  |  |
|---|---|---|
 |  |
Figures 6 to 10 - k-means Visualizations
The above Visualizations may seem to be non informative, but that is certainly not the case. Upon deep analysis, it was found that the clustering above resembled the final league positions of each of these teams in their respective leagues. The clusters are created in such a way that teams with similar performance - Goals conceded, goals scored, number of wins etc - are grouped together. And this can be seen across all the 5 leagues. Please click on each specific visualization to get more details on the same!
Determining the optimal value of k in k-means clustering is an important step in the clustering process, as it can have a significant impact on the quality of the clustering results. The optimal value of k is the number of clusters that best represents the underlying structure of the data, and it is critical to choose the right value of k to ensure that the clustering results are meaningful and useful. The right value of k can lead to Better clustering quality, reduced computational cost and will definitely facilitate data interpretation. Initially, we worked with a range of k values to begin with, so that we could get an estimate of a good k value

Figure 11 - Different values of k
Figure 11 above, gives us initial insights about a good value of k. We used 4 different values of k, initially, to determine which is the best one. As can be seen - for k=2, the cluster seems to be overpopulated with data points. For k=4 and k=5, the left most cluster seems to be a lot skewed and barely qualifies being a cluster. Here, we got the hint that probably k=3 should suit the data at hand.

Figure 12 - Elbow Method
In order to certain the fact that we should cluster with k value of 3, we made se of the Elbow Method (Figure 12 above). This method involves plotting the sum of squared distances (also known as the within-cluster sum of squares) as a function of the number of clusters, and then selecting the value of k at the "elbow" of the curve. And as expected, the elbow curves with the k value of 3.
Hierarchical Clustering
Next, we implemented hierarchical clustering on the dataset, using the hclust() function in R. And the results were quite similar to the ones we achieved using k means.

Figure 13 on the left displays the hierarchical cluster dendogram for the English Premier League - Season 2021-22. As can be seen, the hclust() also classifies the data into 3 clusters as shown. We made use of the cosine distance for this figure
Figure 13 - Dendogram using cosine
We wanted to establish the validity of our results and hence, we created Figure 14 on the right which uses the same dataset as the previous figure. But, here we have made use of the complete method for clustering. And similar to the previous figure, we can see that the dataset is divided into 3 clusters.
Figure 14 - Dendogram using complete

Next, the Silhouette Method. The Silhouette method is another popular technique for determining the optimal value of k in k-means clustering. The method involves computing the silhouette coefficient for each data point, which measures how well the data point fits into its assigned cluster compared to the other clusters.

Figure 15- Silhouette Method
As shown clearly by Figure 15, the Silhouette Method suggests us a k value of 2. This is not in sync with the elbow method and we wanted to get clarity on the same. By making clusters with k=2, the data was not interpretive. The clusters looked way too shabby and there was no detail onto the clusters, they were overloaded with data points. We wanted a more finely grained cluster, and hence decided to take k=3 as the optimum value.
Despite the fact that the Silhouette Methods suggests a different k value, using k=3 for both k-means and hierarchical clustering has yielded similar outputs. The important fact to notice here is not the similarity int he number of clusters, rather, the data points belonging to each cluster. For both k-means and hierarchical clustering, out of 20 possible teams 16 of those were clustered similarly for both k-means and hierarchical clustering. Thereby, it is safe to say that both the clustering techniques perform well on the given dataset
CONCLUSION
In conclusion, clustering methods can be a powerful tool for analyzing soccer data and uncovering trends and insights that can help teams identify what makes them successful. By clustering teams based on different types of data, such as match statistics, shooting statistics, defensive data, and nationalities data, it is possible to identify patterns and relationships that might not be apparent using other techniques.
For our clustering results, as mentioned, similar performing teams have been grouped together based on numerous attributes. It is important to note that, all the good performing teams across a season, have been clustered and skewed to the left, while the teams performing not so good have been clustered to the right. We intend to dig deeper into this trend and check what is causing this skewness and what factors are responsible for the same.
It is also important to carefully prepare and preprocess the data before applying clustering methods, and to choose the appropriate distance metric and clustering algorithm based on the specific characteristics of the data. It is also important to carefully select the optimal number of clusters using techniques such as the elbow method or the silhouette method, while also taking into account domain knowledge, interpret-ability, and resource constraints.
Overall, clustering methods can provide valuable insights into soccer data, but should be used in conjunction with other analytical techniques and with a clear understanding of the underlying statistical and mathematical principles.