
DATA PREP & EDA
DATA GATHERING
Data gathering is of utmost importance as it provides the basis for informed decision making. By collecting relevant and accurate data, organizations can gain insights and understanding about a particular issue or problem, and use that information to make informed decisions that can improve outcomes and drive success.
Data gathering also helps organizations to track progress, identify trends, and make data-driven adjustments to business strategies as needed. Additionally, data gathering can help organizations to identify opportunities for growth, improvement, and innovation.
Nerd Soccer will be focusing on soccer data from the past 11 season (2012-13 to current), across Europe's top 5 Leagues, namely:
-
English Premier League (England 🏴)
-
La Liga (Spain 🇪🇸)
-
Ligue 1 (France 🇫🇷)
-
Bundesliga (Germany 🇩🇪)
-
Serie A (Italy 🇮🇹)
Not only this, across the 5 mentioned countries, varied kinds of data and stats have been gathered including, seasonal stats, offensive and defensive stats, player performance, diversity of players and what not. Data Gathering is an iterative and circular process where-in data is collected so as to ensure that proper analysis can be performed on the same to extract acceptable insights from it. The larger the volume of data, the better and more accurate the analysis, but on the contrary, the more the data, the more time it require to clean/ prep it!
The data to be gathered was in the form of tables, across different websites. Making use of API (Application Programming Interface), the data was successfully fetched for the source URL, but needed to be put in proper format. The below images will make things clearer.
Raw Data

Figure 1 - Raw data
to this

Figure 2 - Raw data (formatted)
Figure 1 above shows the response of the API call which is made to the source URL. As can be seen, the API call returns the required data in an improper format and thus, the same need to be changed before any sense can be made out of it.
Figure 2 represents the RAW data in a proper format, where it is at least making some sense!
As stated, data gathering is an iterative process and the above images are example of just one table that was fetched using an API call. Such steps have been repeated for the whole of the data that has been collected.
Figure 3 below is an example API call which was made use of, to extract data from the source.

Figure 3 - API call
Figure 1 above shows the response of the API call which is made to the source URL. As can be seen, the API call returns the required data in an improper format and thus, the same need to be changed before any sense can be made out of it.
Figure 2 represents the RAW data in a proper format, where it is at least making some sense!
As stated, data gathering is an iterative process and the above images are example of just one table that was fetched using an API call. Such steps have been repeated for the whole of the data that has been collected.
DATA SOURCES:
RAW DATA URLs:
1. https://fbref.com/en/comps/
2. https://fbref.com/en/comps/9/Premier-League-Stats
3. https://fbref.com/en/comps/12/history/La-Liga-Seasons
4. https://fbref.com/en/comps/20/history/Bundesliga-Seasons

DATA CLEANING
Poor quality data can lead to incorrect or misleading conclusions, poor decision making, and negative impacts on the success of an organization or project. Data cleaning involves checking for and correcting errors, inconsistencies, and outliers in data sets, and ensuring that the data is complete, accurate, and in the correct format for analysis. This process also helps to eliminate duplicates and missing values, which can have a significant impact on the accuracy of results. Proper cleaning of data increases the reliability and validity of analysis, making it more trustworthy and useful for decision making.
Data cleaning for this website included tackling the below mentioned aspects (but not limited to these):
-
Handling NAs, zeros and missing values
-
Ensuring data integrity
-
Maintaining proper data formats
-
Identifying Outliers
-
Deleting / Adding Columns for analysis

Figure 4 - Cleaned and Tidy Data
Figure 4 above shows the cleaned data for one such table pertaining to the English Premier League. The above data is clean, tidy, and ready for analysis!
DATA VISUALIZATION
Data visualization is important since it helps to communicate complex data and information in an easily digestible and understandable format. It allows us to quickly identify patterns, relationships, and trends in data, making it easier to gain insights and make informed decisions. Data visualization also helps to simplify large and complex data sets, making it easier to identify important information and uncover insights that might otherwise be difficult to see. Data visualization plays a critical role in the data analysis process by helping to turn data into actionable insights and driving informed decision making.
Below are some visualizations from the gathered and cleaned data. These visualizations are just a glimpse of what this website has to offer. Please click on each specific visualization to get more details on the same!

Figure 5 shows the general finishing position trend of all the clubs that haven been a part of the English Premier League for the last 11 seasons. Notice how there are some clubs which have appeared not more than twice or thrice
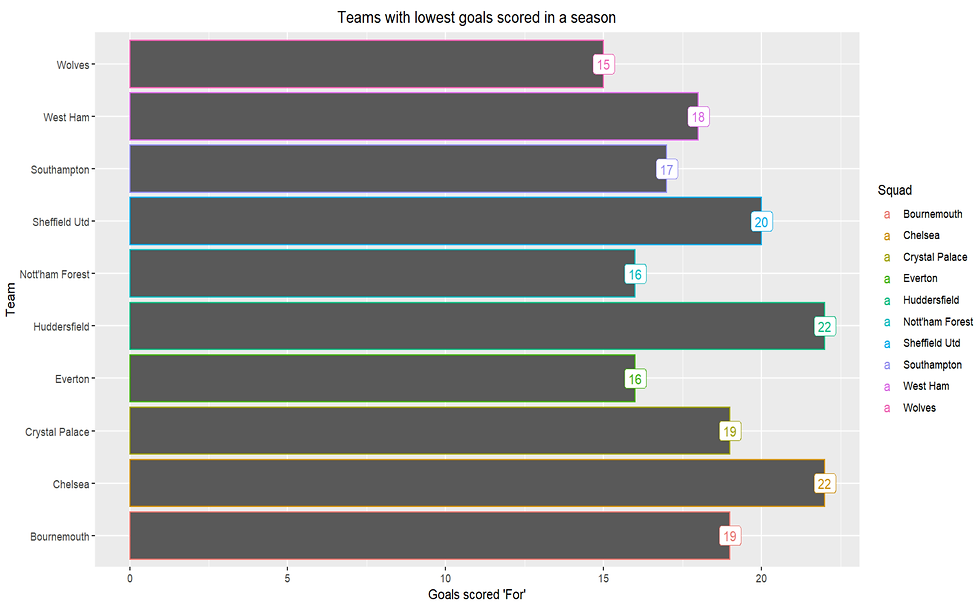
Next up, figure 6 showcases the top 10 teams with the lowest goal scored in a season - for the previous 11 seasons.

Figure 12 shows the density distribution of number of Wins, Losses & Draws for Man Utd across 11 seasons
Figure 5 shows the general finishing position trend of all the clubs that haven been a part of the English Premier League for the last 11 seasons. Notice how there are some clubs which have appeared not more than twice or thrice
Figures 5 to 12 - Visualizations